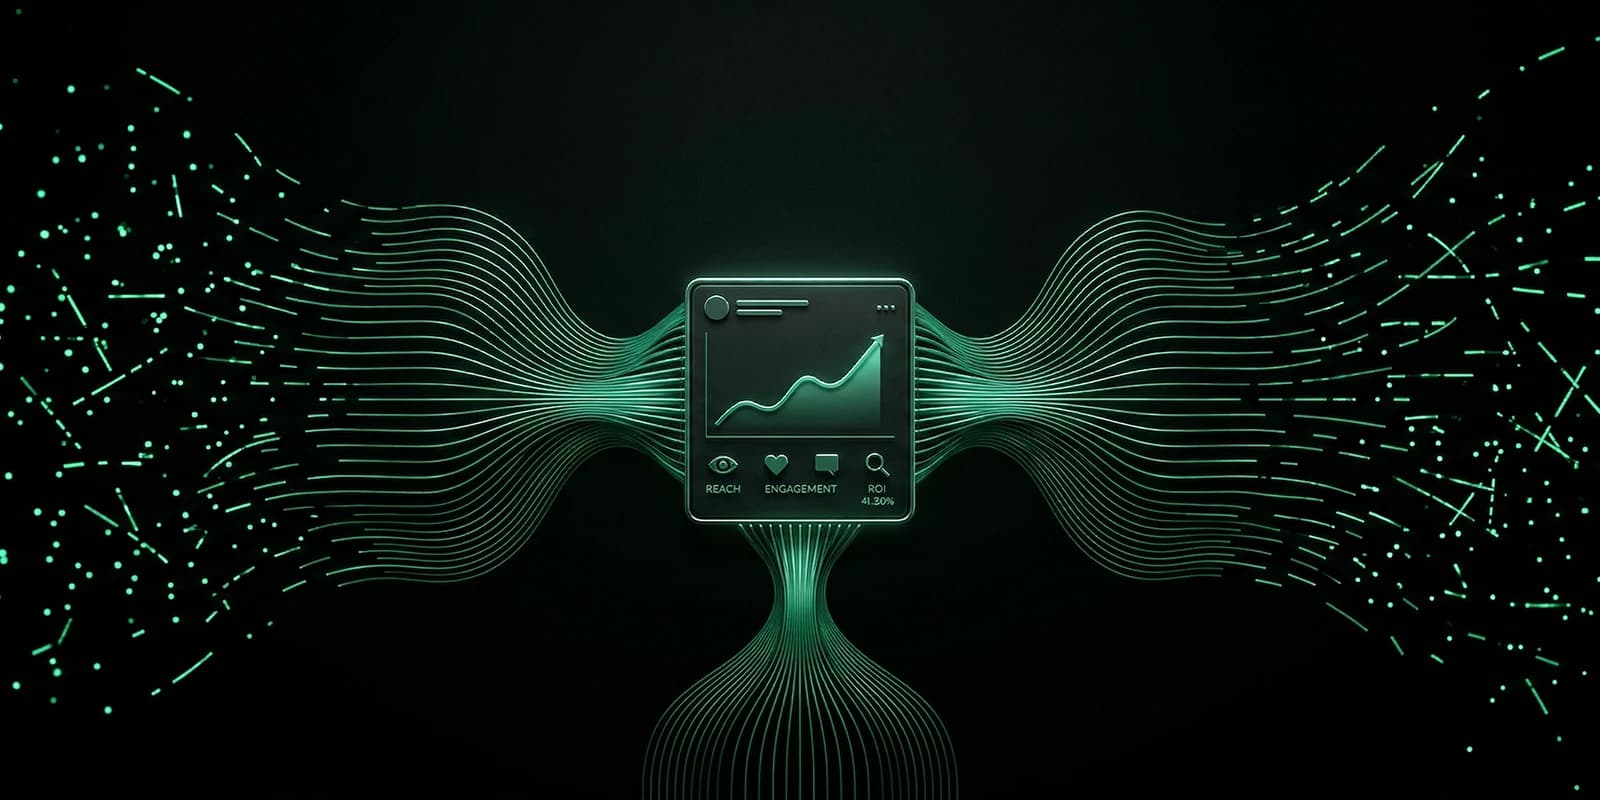
Pella Force Social Media Metrics for Global Leaders: Prove Real ROI | Pella Force
Social Media Metrics That Drive Measurable ROI — The 2026 Tracking Playbook for Every Business
Posted 5/7/2026
13 min read
A
By Atul Lohar
Social Media Metrics That Prove ROI and Drive Real Growth for Global Businesses
Social Media Metrics That Drive Measurable ROI — The 2026 Tracking Playbook for Every Business
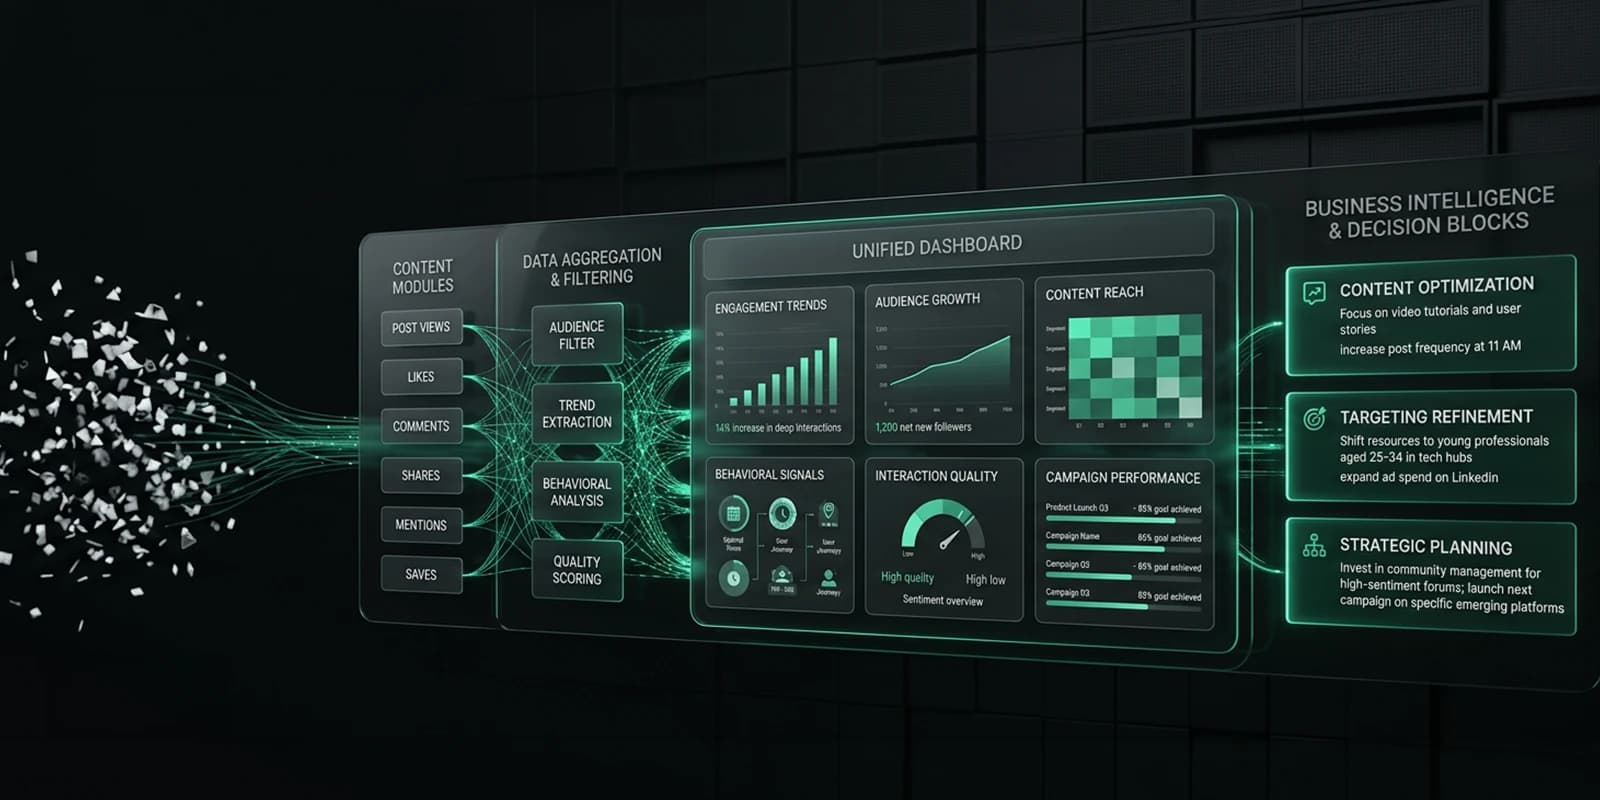
Social media analysis for business 2026 is the process of translating digital interactions into business intelligence. It goes beyond counting "likes" to analyze audience intent, content ROI and global market positioning. The key takeaway is that data is only valuable when it dictates your next financial or strategic move.
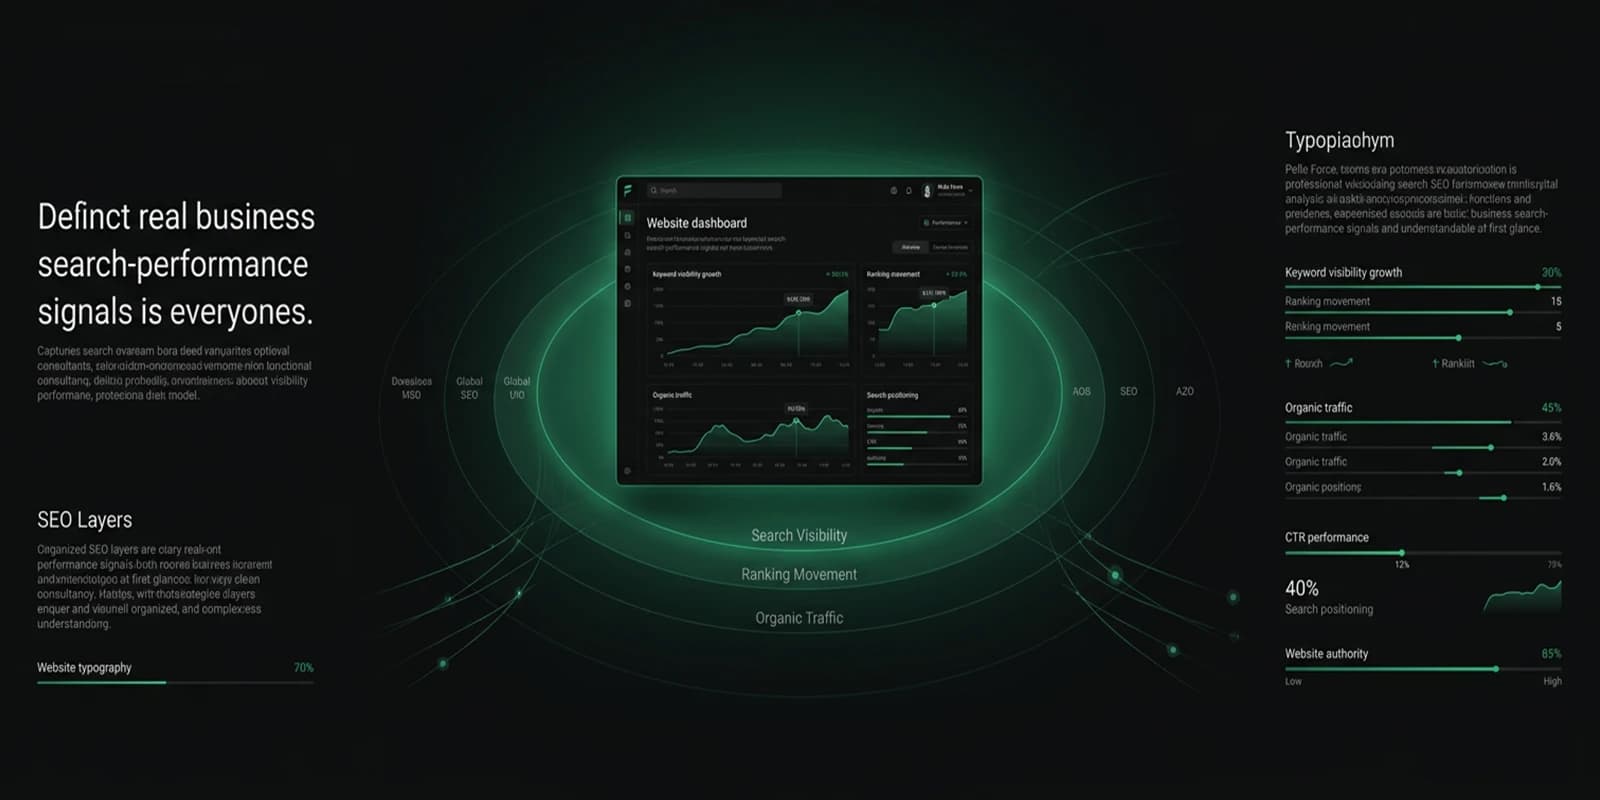
Successful businesses use social media performance analysis at Pella Force to verify audience quality and ensure their social presence drives actual revenue. The digital landscape has now shifted. By 2026, every company has a dashboard full of numbers and very few understand what those numbers mean for their bank account.
This guide is for business owners and global marketing leads who are tired of vanity metrics and need to understand the true impact of their social spend. In this complete blog, you will learn how to distinguish between noise and signal. We will cover the essential metrics for global growth, how to audit your audience quality and how to build a routine that connects social data directly to business decisions.
What Social Media Analysis for Business Actually Covers?
Most people confuse reporting with social media performance analysis. A report tells you that you gained 100 followers. An analysis tells you whether those 100 people are ready to buy your product or whether they are only bots and "follow-for-follow" accounts.
Our modern analysis covers three main areas which are as follows:
Context: It means comparing your data against your specific industry and global market trends.
Intent: It is to understand why a user clicked or commented.
Action: This is deciding what to change in your strategy based on the numbers.
We look beyond tool dashboards in 2026 as we look for the reason behind "why" rather than the "what."
The 8 Social Media Metrics Every Global Business Must Track
Regardless of your industry, these eight metrics of oursocial media audit tell the real story of your brand’s health.
Conversion Rate: The percentage of users who take a specific action (like signing up for a newsletter) after clicking a social link.
Customer Acquisition Cost (CAC): How much you spend on social content and ads to get one new customer.
Share of Voice (SOV): How often your brand is mentioned compared to your biggest competitors.
Sentiment Score: This is the ratio of positive to negative mentions.
Amplification Rate: How often your followers share your content with their own networks.
Customer Lifetime Value (CLV) from Social: It is the total revenue generated by customers who first found you on social media.
Click-Through Rate (CTR): This is the efficiency of your call-to-action (CTA).
Retention Rate: How many of your social media followers stay engaged over a six month period.
Engagement Rate Analysis: Global Benchmarks
Engagement is the heartbeat of our social media performance analysis. However, good engagement varies by platform. A 2% engagement rate might be a failure on TikTok however a huge success on LinkedIn in 2026.
What Good Performance Looks Like by Platform?
Platform
Average Engagement (2026)
High Performance
TikTok
5.5%
12% +
Instagram
1.8%
4.5% +
LinkedIn
1.2%
3.0% +
Facebook
0.6%
1.5% +
Understanding the Context
By Industry: B2B companies usually see lower engagement and higher lead quality. Lifestyle brands see higher engagement and lower direct conversion.
By Market: Emerging markets in Southeast Asia and Africa currently show higher engagement rates than saturated Western markets.
Audience Quality Analysis: Are Your Followers Real?
High follower counts are useless when those followers are your non-target customers. In 2026, our social media analysis for business 2026 focuses heavily on audience quality.
To determine quality, you can have these questions:
Location: Do your followers live in the regions where you ship products?
Interests: Do their other liked pages align with your industry?
Activity: Have they posted or commented on any platform in the last 30 days?
Demographics: Does their age and professional level match your "Buyer Persona"?
When you have 50,000 followers and 80% are outside your shipping zone, your reach is a lie. Quality always beats quantity.
Content Performance Analysis: What Actually Delivers?
Stop guessing what to post. Get our social media strategy report to identify patterns. You can look for these three content signals:
Format Winners: Does your audience prefer "Raw" vertical video or polished graphics?
Topic Authority: Which subjects get the most "Saves" or "Shares"? (Saves indicate high value).
Timing Peaks: When is your specific global audience actually online? Avoid looking for the best time to post articles and instead look at your own data.
Identifying the Patterns
Use heatmaps to see when your audience is most active. When your highest engagement happens at 2 AM, it means you are reaching an international market which is non-targeted yet.
Competitor Social Media Benchmarking
There is no need to see your competitor's private dashboard to understand their strategy. Fair benchmarking is quite enough which involves:
Growth Velocity: Are they gaining followers faster than you? Why?
Content Frequency: How often do they post compared to your brand?
Engagement Quality: Do their followers ask "How much?" or do they simply post emojis?
Ad Transparency: Use platform libraries to see what ads they are running globally.
Compare yourself to aspirational competitors (the market leaders) and direct competitors (businesses your size).
Platform-Specific Analysis: What to Measure?
Each platform serves a different purpose in your sales funnel.
Instagram
Measure: Story Exits and Reel Shares.
Why: Stories show loyalty and reels show reach.
LinkedIn
Measure: Document Click-Throughs and Comment Depth.
Why: Long comments indicate professional thought leadership.
TikTok
Measure: Average Watch Time.
Why: When people drop off in the first three seconds, your hook is weak.
Facebook
Measure: Group Growth and Community Sentiment.
Why: Facebook is now a hub for customer service and community.
How to Build a Monthly Social Media Analysis Routine?
Data is useful only when you use it to change. You can follow our simple 4-step monthly social media performance analysis routine given below:
Review (Day 1 to 2): Pull the eight key metrics mentioned above.
Reflect (Day 3): Identify the top three best performing posts and the bottom three.
Compare (Day 4): Check your competitor’s monthly growth.
Adjust (Day 5): Change your content calendar for the next month based on these findings.
When a content type fails for two months in a row, kill it. When a topic is exploding, double down on it.
What PellaForce’s Independent Social Media Analysis Service Delivers for Global Business Clients?
Tool vendors like Hootsuite or Sprout Social give the "what." However, our social media performance analysis service delivers the "so what?" Our independent social media analysis service assists global clients by:
Giving Unbiased Audits: There is no question of which tool you use. We care about your ROI.
Translating Data to Business Speak: We turn likes into revenue potential reports for your board of directors.
Global Contextualization: We explain why your performance in London differs from your performance in Tokyo.
Strategic Roadmaps: Apart from a PDF, we give you a 90-day plan to fix your gaps.
Effective social media analysis for business 2026 is the difference between shouting into a void and having a conversation in a crowded room. Get ready to use your data to lead.
Conclusion
Social media performance analysis is the bridge between spending money on social media and making money from it. By tracking our right eight metrics, auditing your audience quality with our social media analysis for business 2026 and following a strict monthly routine, you can turn your social channels into predictable growth engines. So contact Pella Force for an independent social media audit to see what your metrics really mean for your 2026 business goals
FAQs
What exactly is social media analysis in 2026?
It is a smart way to collect and study data from social apps to support business growth. It goes deeper than simply looking at basic reports to understand why people are interested in your brand. It focuses on how people feel about your brand and how every post affects your budget in 2026.
How do I see when my social media is making money?
Take the total money made from social media customers and divide it by how much you spent on those apps.
Keep track of what it costs to get one new customer and how much that customer will spend over time.
Look at how different posts work together to lead a person to buy something in different parts of the world.
Which eight numbers are most important to watch?
Conversion Rate: How many people take action after seeing a post.
CAC: How much it costs to get a new customer.
Share of Voice: How much people talk about you compared to your competitors.
Sentiment Score: Whether people are saying nice or mean things about you.
Amplification Rate: How often people share your content.
Click-Through Rate (CTR): How many people click your links.
Retention Rate: How many followers stay interested in you over time.
Audience Growth: How fast you are getting new followers.
What is a good score for likes and comments?
On TikTok, aim for a 12% score or higher.
On Instagram, aim for at least 4.5%.
On LinkedIn, a score of 3% is very strong.
On Facebook, a 1.5% score is normal for a good community.
How do I know whether my followers are good followers?
Check whether your followers live in places where you can actually sell your products. Make sure that their jobs and interests match the type of person who would buy from you. Focus on how much people talk to you rather than only how many followers you have to avoid fake accounts.
What is the difference between a report and an analysis?
Reporting is simply listing numbers like how many "likes" or followers you got. Social media performance analysis explains why those numbers happened and tells you what to change in your plan. Reporting shows the past while analysis assists you plan the future to get better results.
How do I compare my brand to others?
See whether you are gaining followers faster or slower than your biggest competitors.
Use special tools to see whether people talk about you more than they talk about other brands.
Look at what kinds of ads your competitors are running in different countries.
What should I check on Instagram and TikTok?
On Instagram, watch how many people leave your "Stories" early or share your "Reels". On TikTok, look at "Average Watch Time" to see exactly when people get bored and stop watching. On both, make sure your popular videos are actually assisting you sell products.
How do I make a monthly habit of checking data?
Set aside the first week of every month to look at your most important numbers.
Compare your results to other businesses to see where you can improve.
At the end of your check, pick three things to do differently next month based on what the data showed.
Why hire an outside expert for this?
Experts like Pella Force give you an honest look at your data without being biased. They turn confusing charts into simple business talk that everyone can understand. They can assist you understand global markets and give you a clear 90-day plan to grow in your business.
How do you measure social media ROI for enterprise-level global businesses?
To measure social media ROI at enterprise scale:
Set clear business goals (lead generation, brand awareness, revenue)
Combine platform analytics (Facebook Insights, LinkedIn Analytics) with Google Analytics GA4
Assign monetary values to each goal and conversion
Track attribution models across multi-channel funnels
Enterprises using unified social platforms have reported up to 327% three-year ROI
What is the difference between vanity metrics and ROI-driven social media KPIs?
Vanity metrics vs. ROI-driven KPIs:
Vanity metrics — Likes, followers, impressions; measure volume, not business impact
ROI-driven KPIs — Conversion rate, CAC, CLV, revenue attribution; directly tied to business outcomes
Key distinction: Vanity metrics show reach; ROI KPIs show profitability
Global business leaders should prioritize metrics that connect social activity to revenue growth
Which social media KPIs should C-suite executives and global business leaders track?
C-suite and global business leaders should track these high-level social media KPIs:
Revenue influenced by social media campaigns
Customer Lifetime Value (CLV) from social-acquired customers
Social Share of Voice (SSoV) — brand visibility vs. competitors
Net Promoter Score (NPS) influenced by social engagement
Return on Ad Spend (ROAS) for paid social channels
What social media engagement metrics indicate strong brand performance globally?
Key social media engagement metrics signaling strong global brand performance: